Access your Back Office at your fingertips.
Download the app now on Google Play Store.
Scan the QR code
You can also scan QR code with your phone to download the app.
Viewing a report on the Lendsqr Admin Console
Updated
On this page
Data plays an important role in modern lending operations. Beyond loan disbursements and repayments, lenders need visibility into borrower activity, loan performance, repayment trends, operational outcomes, and financial behavior. Access to reliable reporting helps organizations make informed decisions, improve compliance, monitor risk, and strengthen business performance over time.
In Lendsqr, reports provide lenders with access to structured data for reporting, analytics, auditing, and operational oversight. These reports present key information across different areas of lending operations, allowing teams to monitor performance, evaluate borrower behavior, identify trends, and improve internal decision-making.
The reporting feature is designed to make operational data easier to access and interpret. Reports are displayed in a tabular format, supported by filtering options that help lenders narrow down information according to specific needs. Additionally, reports can be downloaded in multiple file formats, making it easier for teams to share data, conduct external analysis, or maintain internal records.
Whether a lender wants to review loan repayments, analyze transaction performance, track borrower sign-ups, or monitor portfolio health, the reporting system provides a centralized way to access important business information.
Understanding reports in Lendsqr
Reports in Lendsqr are structured datasets made available to lenders for operational reporting, analytics, auditing, and performance tracking.
Rather than manually collecting information from different parts of the platform, lenders can access pre-organized reports that consolidate important business data into one location.
These reports are available in a table format, making it easier to review individual records, compare performance trends, and extract relevant insights.
The reporting system supports different operational needs, ranging from high-level business performance monitoring to detailed transaction-level reviews.
For example, operations teams may review loan repayment reports to monitor repayment behavior, while compliance teams may use transaction reports to support auditing requirements. Customer success teams may review sign-up reports to understand borrower acquisition patterns, and portfolio managers may analyze loan performance reports to evaluate lending outcomes.
Because lending operations involve multiple moving parts, having centralized reporting improves visibility and decision-making across teams.
Types of reports available in Lendsqr
Lendsqr provides access to different categories of reports based on operational needs.
User reports
User reports provide visibility into borrower activity and customer information.
These reports may help lenders understand user behavior, onboarding trends, borrower demographics, or account-related activities.
For example, lenders may review user-related reports to identify inactive borrowers, track account creation patterns, or evaluate borrower engagement over time.
Loan application reports
Loan application reports help lenders monitor incoming applications and approval workflows.
These reports can provide insights into application volumes, approval rates, declined requests, and borrower qualification trends.
Organizations often use these reports to improve lending strategies and evaluate whether credit assessment processes are functioning effectively.
Sign-up reports
Sign-up reports focus on borrower registration and onboarding activity.
For example, lenders may analyze registration patterns to understand acquisition trends, identify growth opportunities, or evaluate the performance of onboarding initiatives.
This information can be especially valuable for organizations scaling digital lending operations.
Loan performance reports
Loan performance reports help lenders evaluate portfolio health.
These reports often provide visibility into repayment behavior, default patterns, overdue balances, and portfolio outcomes.
For example, a lender may review performance reports monthly to assess whether a lending product is performing as expected or whether approval criteria require adjustment.
Transaction reports
Transaction reports provide detailed visibility into financial activities occurring on the platform.
This may include wallet movements, transfers, charges, disbursements, or other transaction-related activity.
Finance and operations teams often rely on transaction reports to reconcile records and monitor financial performance.
Loan repayment reports
Loan repayment reports help lenders monitor repayment consistency and borrower payment behavior.
These reports may reveal missed repayments, repayment completion trends, or changes in borrower payment patterns over time.
For lenders, reports serve as an important decision-making tool that helps organizations evaluate performance, maintain transparency, and strengthen operational oversight.
For example, portfolio managers may use loan performance reports to identify early warning signs of rising defaults. Operations teams may rely on transaction reports to investigate discrepancies, while compliance teams may require reports for audit preparation.
Reporting also supports strategic planning. When lenders understand borrower behavior, repayment patterns, and product performance, they can make more informed decisions about pricing, credit policies, and customer engagement.
Without reliable reporting, organizations may struggle to identify operational inefficiencies or respond effectively to emerging risks.
Understanding report filters
Reports in Lendsqr include filtering functionality that allows lenders to narrow down data according to specific requirements.
Filters make it easier to focus on relevant records rather than reviewing large datasets manually.
For example, lenders may filter reports by date range to review activity during a specific time period. Teams investigating operational issues may filter data according to transaction type or borrower activity.
Using filters effectively helps improve reporting accuracy and reduces the time required to locate specific information.
For organizations handling high volumes of lending activity, filtering becomes especially valuable when analyzing trends or preparing reports for internal stakeholders.
Understanding report downloads
Lendsqr allows lenders to download reports in multiple formats for easier analysis and record keeping.
The available download formats include:
CSV (.csv) for spreadsheet analysis and system imports.
Excel (.xlsx) for advanced reporting and operational reviews.
JSON (.json) for technical workflows, integrations, or structured data processing.
These options provide flexibility depending on how teams intend to use report data.
For example, finance teams may prefer Excel files for reconciliation, while technical teams may work with JSON files for system integrations or automation.
Having multiple export options improves accessibility and allows lenders to integrate reporting into broader operational workflows.
Viewing reports within the Lendsqr Admin Console follows a straightforward process.
Step 1: Navigate to reports
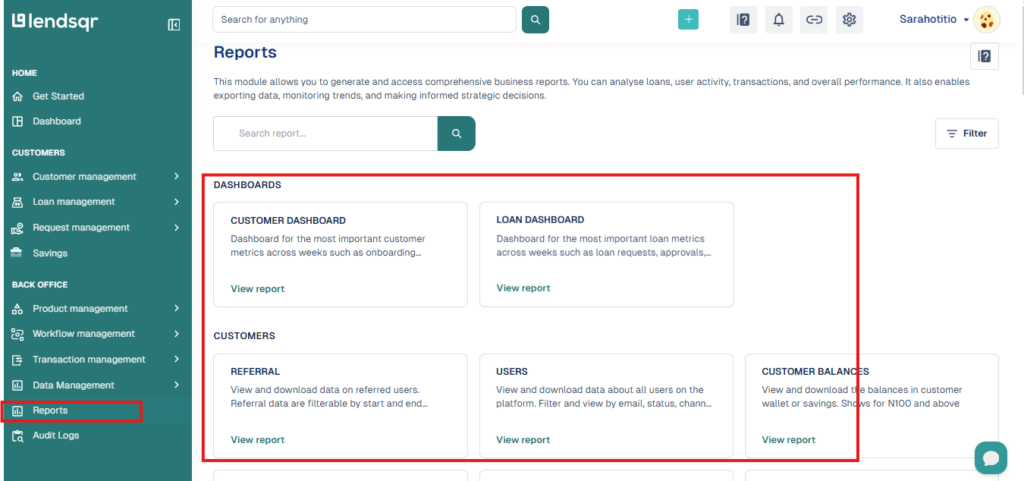
Begin by logging into the admin console. From the side navigation menu, locate and click the Reports tab. This section serves as the centralized reporting hub where all available reports can be accessed.
Step 2: Select a report category
On the reports page, you will see different cards representing available report types. Each card corresponds to a specific report category such as users, loan applications, transactions, repayments, or loan performance.
Select the report you want to view based on the information you need.
Clicking the desired report redirects you to the report data page.
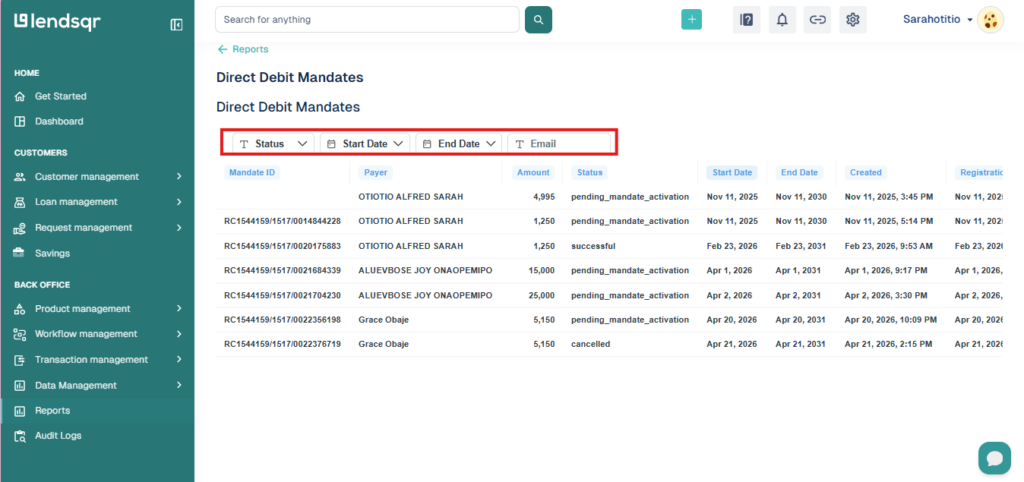
Step 3: Apply filters
At the top corner of the report data page, you will find available filters.
Use these filters to narrow results according to your reporting needs.
For example, you may filter data based on the reporting period or email to focus only on relevant records.
Applying filters before reviewing large datasets often makes reporting more efficient.
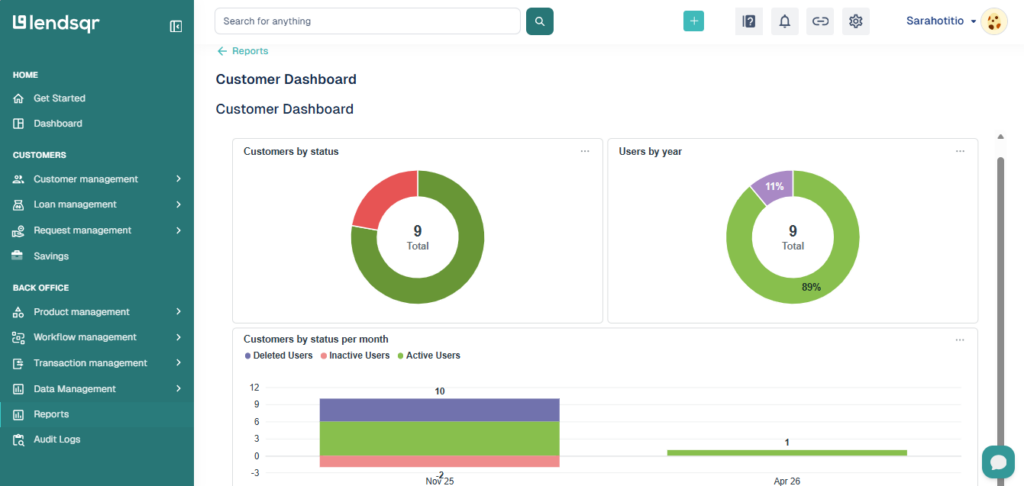
Step 4: Review report data
The main content area of the page displays a table containing multiple rows of report data.
Each row represents an individual record associated with the selected report.
For example, repayment reports may display borrower repayment entries, while transaction reports may show wallet activities or transfers.
Reviewing this table allows lenders to monitor activity, investigate issues, and identify trends within operational workflows.
Step 5: Navigate report pages
At the bottom-right section of the table, you will find navigation controls and the number of available rows within the report.
These controls help lenders move through large datasets more efficiently.
This functionality becomes especially useful when reviewing high-volume lending operations.
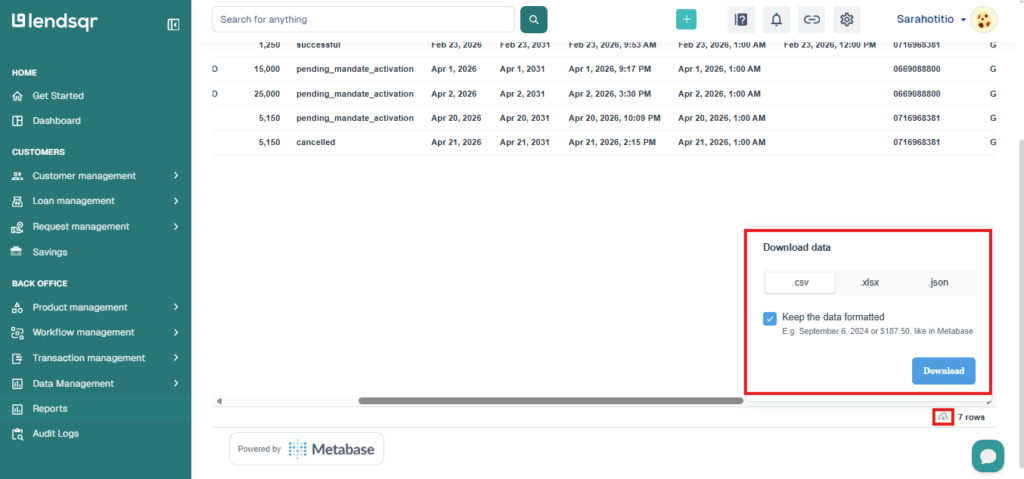
Step 6: Download the report
Below the navigation controls, locate the cloud icon.
Clicking this icon displays the available download format options.
You can export reports in .csv, .xlsx, or .json format depending on your operational requirements.
Downloading reports makes it easier to conduct external analysis, prepare presentations, or share information across teams.